Increase in the Industrial Vacancy Rate of 6.4% Suggests Temporary Supply-Demand Imbalance In Market


New research indicates that as of August 2024, the national industrial vacancy rate in the U.S. was approximately 6.4%, reflecting an upward trend from the previous months. That same month, the Logistics Manager’s Index (LMI) stood at 56.4, reflecting moderate expansion in the logistics industry, albeit a slight decrease (-0.1) from July’s reading of 56.5. The data comes from the Q3 ITS Logistics US Distribution and Fulfillment Index, Powered by Cresa.
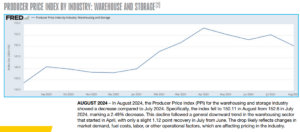
“This trend of increasing vacancy rates suggests a temporary supply-demand imbalance as new developments outpace demand growth in certain regions,” said Ryan Martin, President of Assets for ITS Logistics. “The increasing vacancy rate is likely related to the drop in producer price index (PPI), suggesting that prices are softening for warehousing and storage services. As new supply continues to enter the market, especially in major industrial hubs, pricing pressure could persist unless demand accelerates or development slows down.”
A recent article from The Wall Street Journal referenced data retrieved from Cushman & Wakefield, confirming warehouse construction dropped to 309 million square feet in Q3, a 43% decrease from last year and the largest decline since 2008. In addition, the previously mentioned industrial real estate vacancy increase of 6.4% is up from 4.6% a year ago, which marks the highest level since late 2014. While the average asking rental rate for industrial space exceeded the $10 per square foot (psf) level for the first time in history at the close of Q3 at $10.08 psf, it showcases an increase of 4.3% year-over-year as some markets are continuing to experience increases in rent despite softer fundamentals than the past three years.
“As it pertains to the LMI score, by comparison, in March 2024, the LMI was higher at 58.3,” continued Martin. “This indicated a faster rate of expansion earlier in the year. Between March and August, the slowdown in the LMI suggests that while logistics activities continued to grow, they did so at a decelerating pace. A notable factor during this period was the slight contraction in warehousing utilization and capacity, reflecting adjustments in supply chain management as the industry dealt with inventory fluctuations and cost pressures.”
While the industry prepares for the close of the year, both UPS and FedEx have released their 2024-2025 peak season surcharges, which will significantly impact high-volume shippers. UPS and FedEx will begin applying these fees this month, including both peak and demand surcharges. Surcharges range from $0.30 to $100 per package, depending on the characteristics of the package and the data it ships. Both carriers are targeting businesses that ship over 20,000 packages per week. To manage these increased costs, ITS suggests companies review their peak season data and adjust their shipping strategies accordingly.
ITS Logistics offers a full suite of network transportation solutions across North America and omnichannel distribution and fulfillment services to 95% of the U.S. population within two days. These services include drayage and intermodal in 22 coastal ports and 30 rail ramps, a full suite of asset and asset-lite transportation solutions, omnichannel distribution and fulfillment, and outbound small parcel.

The ITS Logistics US Distribution and Fulfillment Index tracks the Producer Price Index (PPI) for Warehousing and Storage and offers a regional markets overview to optimize warehousing and delivery costs. All major markets in the US are highlighted each quarter via the Index. Visit here for a full, comprehensive copy of the index with expected forecasts for the US distribution and fulfillment sector of the supply chain industry.


